Special Free Report From The Motley Fool
A very warm welcome, new Fools!
If you’re familiar with The Motley Fool at all, you may already know that our mission is to help make the world smarter, happier, and richer.
Today, we aim to help you accomplish all three of those goals by calling your attention to what we believe are five outstanding stocks you can buy and hold in your TFSA for years to come. We’ve selected these companies with four guiding principles in mind…
Foundation: Companies that build the bedrock of your portfolio with a heavier allocation. In this category, we’ve selected Brookfield Asset Management and Canadian National Railway.
Value: Companies that appear deeply undervalued and that we’re waiting for the market to “catch-up” on. Here, we’ve selected Tricon Capital.
Huge growth potential: Companies with the potential to become the next big growth story… maybe even the next Lululemon. For growth, we’ve selected Aritzia.
Dividends: Companies that pay consistent, recurring dividends that can be counted on for steady returns. Here, we’ve selected Dream Industrial REIT.
In this special “TFSA Titans” report, we hope you’ll be able to begin (or continue) fully taking advantage of your TFSA with these five stocks we’re especially keen on.
Without further ado, please enjoy the following five recommendations pulled from an assortment of our Canadian stock-picking services in full.
To your wealth,
Your Motley Fool Canada Team
Brookfield Asset Management
From Motley Fool Canada Pro Team
What We’re Thinking
Special companies—companies that make that life rather enjoyable and lucrative—come along every so often in one’s investing life. These companies tend to share a collection of traits and, in hindsight, appear obvious. In the here and now, however, with all the distractions that exist out there, not so much.
Beyond identifying them, the key to investing in these special companies is to make them an outsized position in one’s portfolio.
Fellow Fools, in our opinion, Brookfield Asset Management (TSX:BAM.A) is one of these “special” companies—one that we feel uber-confident in making an outsized position in the Pro Canada portfolio. In fact, I’m not sure there’s a company in the portfolio that Jim or I (Iain here) are more comfortable with at this moment.
That said, comfortable should not be confused with complacent. Indeed, just as with any company/stock, we’re not saying an investment in BAM will provide a straight ride up. There will be bumps along the way—especially when dealing with an entity as vast as this. And it may seem like a grind at times. But those bumps are more likely to be treated as opportunity more than anything—opportunity to continue building this position. Because a decade from now, those bumps will almost assuredly be nothing but, and we foresee this company is going to be worth a whole bunch more than it is today.
For now, we want our “comfortable” views well reflected in the Pro Canada portfolio, and therefore we’re upping our exposure to this somewhat unheralded Canadian champion.
In the meantime, if you want an example of what makes Brookfield so special in our books, we don’t think you can go wrong reviewing the quarterly letters from CEO Bruce Flatt. This snippet from the most recent letter encapsulates what we, and apparently they themselves, love about their performance (note: currency in the table below is in U.S. dollars):

That’s a nearly 20-year track record where essentially any measure you’d care about compounds at between 15% and 19%—consistent, profitable results, and yet the company has been miserly with the share count, respecting its own (and our) equity. Don’t get used to that share count, however, One of Brookfield’s goals, with record, and growing, free cash flow, is to reduce the share count to below where it was in 1999. Management has indicated this as a “medium-term goal” and will undertake such exercise only when it believes it’s buying the shares below intrinsic value. If you read that letter, you’d come away with the impression that Flatt believes the current share price meets that criteria. We listened and are adding today so as to benefit.
How it Fits Into Your Portfolio
We’ve previously highlighted Brookfield as a fine example of a “compounding machine”—companies with wide “moats” or, even better, widening moats, and the ability to earn high returns and then reinvest at those high rates for many years to come. We like to see a history of organic profitable growth and durable competitive advantage. We have no reason to re-classify the company today.
Canadian National Railway
From Motley Fool Stock Advisor Canada Team
An industrial sector stalwart, this railroad is as blue as blue chips come in the Canadian market. It is an ideal holding for all long-term-focused investors.
Why Buy:
- Best-in-class rail network that connects three coasts in North America with more than 20,000 route miles of track.
- The owner of an irreplaceable asset in an industry with insurmountable barriers to entry.
- Loads of opportunities ahead, which should ensure that double-digit returns on capital continue for years to come.

| Headquarters | Montreal, Quebec |
| Website | www.cn.ca |
| Industry | Railroads |
| Volatility | Medium |
| Market Cap | CAD$1,777.5 |
| Cash/Debt | $214/$7,840 |
| Revenue (TTM) | $10,575.0 |
| Earnings (TTM) | $2,612.0 |
| Total Inside Ownership | 0.26% |
| Recent Price | $62.09 |
| Yield | 1.61% |
| TTM = Trailing 12 Months | |
| Dollar amounts in millions except recent price. | |
| Data as of our initial buy recommendation on March 6, 2014 | |
Aside from maybe Hockey Night in Canada, I can think of few more prominent Canadian institutions than the railroad. The railroad is part of what has made Canada what it is today. And though it has evolved over the years, and certainly plays a far different role than it did prior to the advent of the automobile, the railroad continues to be a tie that helps to hold our country together—indeed, it truly serves as a backbone to our economy.
There are, of course, two national railways in this fair country, but just one is ideally suited for your portfolio. Canadian National Railway (TSX:CNR)(NYSE:CNI) has played a significant role in the evolution of the Canadian economy, and it has produced outstanding returns for longterm shareholders in the process. We don’t see a reason for either dynamic to change in the decades to come.
Blue-Chip Special
Building a portfolio is a bit like building a house. Like a house, every portfolio needs a solid foundation—that is, every portfolio needs to contain a collection of companies that are virtually assured of being worth more in 10 or 20 years than they are today. These kinds of companies aren’t going to win over any friends at a cocktail party, or make you look like a “guru” by surging ahead in a single day of trading. What they are likely to do, however, is protect your capital and earn you a very steady, and over the long term, spectacular risk-adjusted return. Canadian National Railway (CN Rail) is one such company.
Unique Asset
The primary reason I’m so confident in this longterm prognosis is the company’s underlying asset. CN’s 20,000 route miles of track blanket North America and touch three coasts: the Atlantic, the Pacific, and the Gulf of Mexico. This expansive network makes CN one of the go-to transporters of goods that are either set to leave North America or need to be distributed throughout North America.
Goods that travel across this vast network include such things as petroleum, chemicals, metals/minerals, forest products, coal, grains and fertilizers, intermodal (i.e., manufactured goods that arrive in big containers from Asia), and automobile-related materials (parts and cars).
Its ability to efficiently transport these goods across the continent makes CN’s rail network one of the greatest assets imaginable. Cross-continent bulk transportation networks are rare, and if you own one, and manage it properly, they serve as a fantastic way to build wealth. Just ask Warren Buffett, whose Berkshire Hathaway wholly owns U.S.- based railroad Burlington Northern Santa Fe, or his buddy Bill Gates, who owns 10% of CN Rail through his investment company, Cascade Investment.
It Gets Better
Because of the unique nature of CN’s asset, the company has incredibly deep ties with its customer base, which only helps to deepen the moat around its business. CN plays an integral role in how its customers do business. It is essentially irreplaceable for many of them.
Not only that, CN is also the best railroad operator in North America, as evidenced by its peer-leading operating ratio of 63.4%. (Operating ratio = Operating expenses/revenues.) This is a critical component of the story because customers tend to like dealing with the best. Also in CN’s favour: Reliable service not only helps retain existing customers but also attract new ones. And the deeper these customer relationships are, the stickier they tend to be.
Full Steam Ahead
That combination—a great asset, deep customer ties, and best-in-class operations—means CN’s future is bright. Opportunities abound to reinvest in this equation and continue to earn a meaningful return. Over the past five years, CN has spent $8.3 billion on capital expenditures (far exceeding the depreciation of its assets, which amounted to $4.4 billion) and has earned an average return on capital over this period of 11.4%. The company expects to spend another $2.1 billion on capital expenditures in 2014, and as long as it can continue generating 12% or so returns on this invested capital, investors should do very nicely.
The bulk of its spending has been plowed back into improving its network and track infrastructure. Also receiving a good chunk of the capital spend: new locomotives and new facilities to help grow the business, such as transloading terminals, distribution centres, and a new Calgary Logistics Park.
Perhaps the most recognized (though not necessarily most significant) growth lever for CN in recent years has been the controversial move toward transporting increasing amounts of crude oil by rail. CN’s crude carloads have surged to approximately 70,000 in 2013 from approximately 5,000 in 2011. While the company expects this energy-related business to continue to grow in the coming years as pipeline systems remain constrained, if it were to be abolished due to safety concerns, those 70,000 carloads are relatively insignificant compared to the approximately 5 million carloads that CN carries annually.
While there’s little reason to believe that the tailwind from energy-related transport will blow through anytime soon, even if it does, CN’s other business lines have more than enough potential to pick up the slack. For instance, significant upside for the company’s intermodal division was cited at a recently held Investor Day.
The three components of CN’s overall growth strategy include expanding the company’s geographic reach, offering new products (which oil falls under), and taking an innovative approach to service. Not one of these components requires CN to reach very far outside of its comfort zone, and the combination is expected to drive above-trend top-line growth going forward.
What About That Other Railroad?
The other national railroad here in Canada is Canadian Pacific Railway (TSX:CP)(NYSE:CP). For a period, CN was clearly the superior operator, even though the collection of freight transported is similar, as is both of their geographical footprints, at least in Canada (CP doesn’t go any further south than Kansas City, which means it misses out on the critical Gulf Coast region). The operating gap, however, has narrowed considerably. CP’s operating ratio currently sits at about 70%, which is down from the high- 70% range that it inhabited just three years ago.
Many of the business-related characteristics we’ve used to describe CN thus far can almost be repeated verbatim for CP. The big difference is that although CP’s operations have improved dramatically, thanks in large part to former CN CEO Hunter Harrison, the market has rewarded this performance with a collection of multiples that eclipse CN’s.
Aside from the aforementioned operating ratio, CN continues to lead CP on a number of performance-related metrics.
| Return on Equity | Return on Capital | EBIT Margin | Total Debt/ Equity | |
|---|---|---|---|---|
| CN Rail | 21.8% | 12.5% | 36.6% | 60.5% |
| CP Rail | 14.4% | 10.6% | 30.1% | 68.7% |
Source: Capital IQ
And as you can see below, CP’s multiples don’t correspond to the fact that it’s the inferior operator of the two; the market is giving CP credit for improvements that have not yet occurred. We prefer to take the bird in hand, so to speak, and not trust that CP will “get there,” as the market assumes—especially if “getting there” appears more or less priced in.
| TTM P/E | Forward PE | Price/Book | |
|---|---|---|---|
| CN Rail | 20.2 | 18.0 | 4.0 |
| CP Rail | 35.3 | 20.4 | 4.3 |
Source: Capital IQ
All Aboard
We love finding a hidden gem as much as any investor, and we think we’ve come up with a few thus far in Stock Advisor Canada. But our mandate here is to help you find market-beating stocks. In the case of this month’s recommendation, we think we’ve found that in the form of a rock-solid blue chip.
There will be short-term hiccups along the way, caused by such things as a bad grain harvest or weather issues, but over the long term, from a risk-adjusted standpoint, we can think of few other companies more worthy of a place in your portfolio than CN Rail.
Tricon
From Motley Fool Discovery Canada Team
What Tricon Capital does
Though its roots will remain entrenched in the world of real estate, and primarily, residential real estate across the U.S. Sun Belt, the business mix is about to change. Thanks to its recent acquisition of Silver Bay Realty Trust (NYSE:SBY), Tricon is very much a company in the midst of a transition – for the better.
With the addition of Silver Bay’s portfolio of 9,044 single-family rental homes, Tricon will become the fourth-largest publicly owned company in this vertical, with a total portfolio of almost 17,000 homes. These residences are scattered across the U.S. south, from Georgia to California, and are targeted at a midmarket clientele with annual income of $50k-$95k per year.
Tricon and Silver Bay each began accumulating their respective rental home portfolios in 2012, still firmly in the wake of the financial crisis, as this corner of the market remained mired in a slump. For most of this period, Tricon has been reliant on third-party providers to manage its growing portfolio of homes. But in the past year or so, Tricon severed ties to these outside providers. Now, Tricon American Homes (TAH) is a full-service entity that buys, renovates, and leases homes to steady-income families. And when the Silver Bay acquisition closes, this will be Tricon’s largest division.
The other significant division within the company is Tricon Housing Partners (THP). This is somewhat of a legacy business for the company, which sees it invest third-party capital, as well as capital from its own balance sheet, alongside residential real-estate developers, again, across the southern U.S. Asset management fees are gleaned from the third-party capital Tricon manages, and the division has benefitted from a solid track record of capital appreciation through its investments in the earlier stages of the real estate life cycle.
Two other divisions under the Tricon umbrella, Tricon Luxury Residences and Tricon Lifestyle Communities, are set to be either pared back or sold off entirely, as the company streamlines to focus on Tricon American Homes and Tricon Housing Partners in the years ahead.
What makes it unique?
To have accumulated a portfolio of more than 17,000 single-family rental homes over the past several years or so is no small feat. And given that this portfolio was assembled in the wake of one of the worst housing markets that anyone can recall, the economics underlying it are virtually impossible to replicate.
Of similar importance, and as we look to the future, it’s likely that the platform the company has built to manage and grow this portfolio will prove equally unique. This platform will give Tricon the edge as it reinvests the cash thrown off by its existing portfolio into more and more homes. Just as there aren’t many 17,000-rental-home portfolios kicking around, there also aren’t a lot of operations capable of managing this kind of portfolio.
Why we like the stock today
In our mind, the pairing of these two approaches, rentals and development, makes for intriguing total return possibilities.
As it stands, Tricon sports a dividend yield of 2.4%, and it won’t come as a surprise if dividend increases become a part of this story in the years ahead, given the cash-generating characteristics that coincide with a sizeable rental-home portfolio. That said, reinvesting in this portfolio, as well as alongside Johnson, will be front and centre for Tricon for the foreseeable future.
Describing Tricon American Homes’ opportunity as “vast” is somewhat of an understatement. Residential real estate in North America has always been rather mom-and-pop. Portfolios as big as Tricon’s haven’t existed in the past, and as noted, they’re still very rare. Tricon expects to add to its portfolio through distressed sales, traditional retail channels, and bulk acquisitions, if it can find them. Distressed sales alone, however, which have averaged about 800,000 per year in the U.S. since 2005 (about 500,000 per year outside of the crisis years), should provide enough supply to make a difference to Tricon, and its shareholders, for years to come.
On the TPH front, Tricon is focused on eight Sun Belt states, with six of these markets expected to have the highest absolute population growth of all the U.S. states from 2016 to 2021. In addition, six of these markets ranked within the top 10 states for employment growth in 2015. With the three most important variables to succeeding in real estate being 1) location, 2) location, and 3) location, demographic and economic trends favour the markets that Tricon knows best.
Potential Risks
Broadly speaking, an overarching consideration anytime you’re dealing with a financial company is the balance sheet. To remain as enthusiastic about Tricon as we are, and for the company to achieve its potential, it must hold financial risk in check. It took on debt a couple of years ago to complete the Silver Bay transaction — more of its own, and Silver Bay’s — but at this stage, the burden appears entirely manageable. We’ve no concern on this front, but it’s something to pay constant attention to.
Why this could be the next Home Run Stock
In the big picture, a continued accumulation of rental homes across the current footprint, as well as continued success developing new properties, will carry the day for Tricon.
Though I wouldn’t call the company necessarily cheap, I also wouldn’t call it expensive, at about 1.03 times book value. Peer Howard Hughes, a company that has business along the lines of Johnson Development and the THP business, trades at 1.5 times book value. In fact, compared to the past few years, this is among the cheapest Tricon has traded compared to its book value.
Provided management is able to execute through the merger, and realizes the growth alluded to, we not only foresee a bigger company in five years’ time, but also one that trades at a more substantial multiple – and pays a dividend along the way.
How Tricon Capital fits into your portfolio
When it comes to small-cap opportunities, Tricon is certainly at the sturdier end of the spectrum. Its business is well-established, and there’s a clear strategy laid out for the road ahead. The financial part of the equation is also in good shape, which certainly isn’t always the case when it comes to small-caps.
Given that we’re working from such a stable base, in our mind Tricon warrants an allocation that’s significantly larger than a company where speculation is a bigger part of the equation. Based on our collection of 20 companies, we plan to allocate 8% of the capital we’ve available to Tricon.
Aritzia
From Motley Fool Stock Advisor Canada Team
Aritzia is a vertically integrated designer and retailer of apparel and accessories for women in North America, which it sells under the Wilfred, Babaton, TNA, Sunday Best, and SuperWorld brands.
Why Buy:
- Founder Brian Hill brings nearly 40 years of elite execution and leadership.
- Top-tier sales per square foot and same-store sales growth reflect a business to admire.
- It has a runway to nearly triple its U.S. store base as well as extend brands into new categories like swimwear, intimates, and menswear.
| Headquarters | Vancouver, BC |
| Website | www.aritzia.com |
| Industry | Retail |
| Volatility | Medium-High |
| Market Cap | $4,155.3 |
| Cash/Debt | $265.2/$0 |
| Revenue (TTM) | $1,494.6 |
| Earnings (TTM) | $156.9 |
| Total Inside Ownership | 20% |
| Recent Price | $37.44 |
| Yield | 0% |
| TTM = Trailing 12 Months | |
| Dollar amounts in millions except recent price. | |
| Data as of May 10, 2022 | |
By Iain Butler and Nick Sciple
The tens of you that tune in to our bi-weekly Fool Canada Power Hour (next episode is Wednesday, May 18) are well aware that your Stock Advisor Canada investing team is a well-tailored bunch. Jim wears a fleece like no other; Nick and Nate are consistently swathed in the latest and greatest of giveaway t-shirts; and my grey hoodie is never out of reach. Yes, Fools, to call us trendy would be an understatement.
Right?
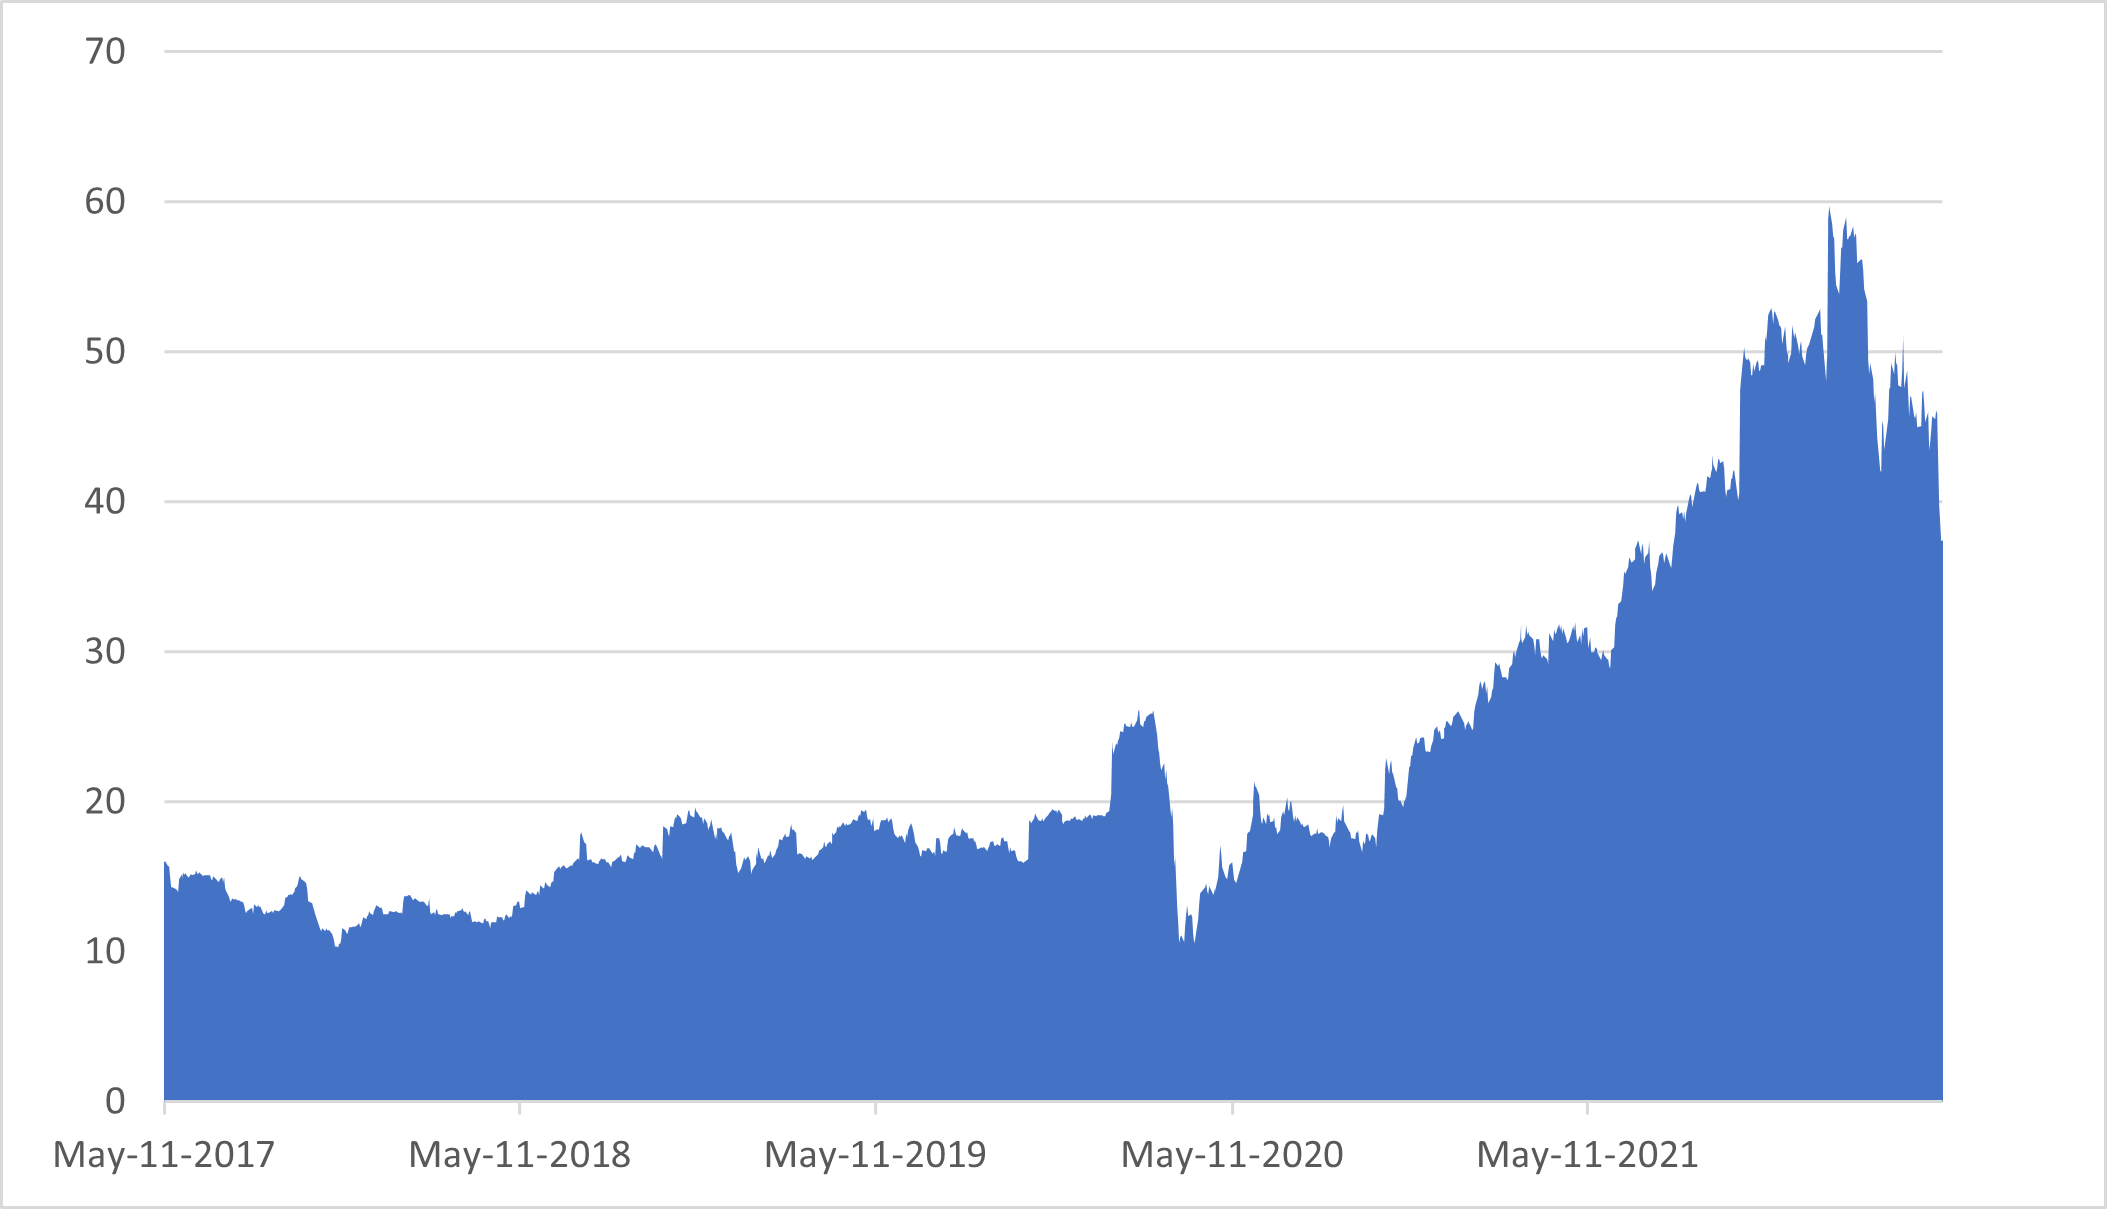
Alright, alright … what the team lacks in terms of knowing our way around a closet, we think we make up for when it comes to our ability to assess a business and its prospects. And while our insight into the fashion that Aritzia (TSX:ATZ) provides doesn’t amount to much, it’s rather clear that not only is this a really well-run business, but given the infantile state of its ongoing U.S. expansion—despite this being a 38-year-old company—we’re still in the very early innings of what could turn into a Lululemon’esque (NASDAQ:LULU) growth story.
We were intrigued by Aritzia from the moment we took our first real look back in late 2018. Since then, we’ve become downright enamoured by the business. Yet, by the third look, the stock had run to the point that valuation became a deterrent.
Today, though, thanks to the state of the market, our valuation concern has faded and we’re left with a fantastic business that we can put forward at a better than fair price. Heck, despite the stock price being more than double what it was on our first look, the company has outperformed the stock and, therefore, multiples are essentially back to where they were in late 2018.
It feels like we’ve been given a second chance with Aritzia, and we’re not passing on it again.
What Is an Aritzia?
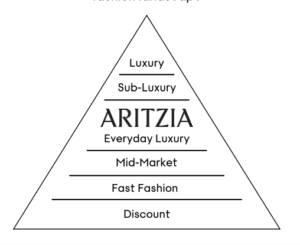
Aritzia founder Brian Hill comes from a family of retailers. His father Jim founded Hills of Kerrisdale in Vancouver in the 1920s, where Brian came of age learning the family business. In 1984, shortly after he graduated college, Brian opened the first Aritzia store in a high-end Vancouver mall. As Brian told Business of Fashion in 2009, he saw a hole in the market: “Back in 1984 I saw a market opportunity, somewhere in between the luxury market and the junior market in women’s fashion, for young women who have significant disposable income, but don’t want disposable clothes. These young women were seeking the experience of a boutique but didn’t really have access to it.” Today, Aritzia calls its offering “Everyday Luxury.”
Unable to find the products Brian wanted in the marketplace, Aritzia developed its own brands, under names like Wilfred, TNA, Babaton, and SuperWorld. Today, Aritzia’s in-house brands make up more than 70% of its retail sales. By designing its products in-house, Aritzia not only receives margin benefits but also is better able to control its inventory and respond to trends—an absolute must in the fashion industry.
The concept was a hit. After growing to a handful of stores in the Vancouver area, the company went nationwide in Canada in the late 1990s. Then, in 2005, Hill partnered with private equity firm Berkshire Partners, which positioned the company for growth in the United States. In 2013, Aritzia launched its e-commerce site to augment its boutique business—something that’s now become a growth driver on its own account.
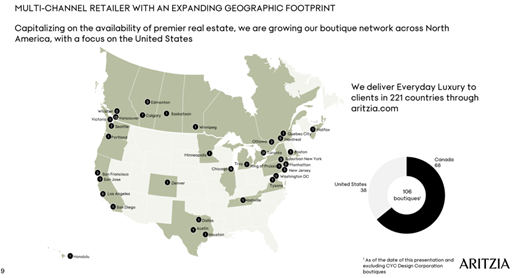
Today, Brian Hill remains as executive chairman, recently passing the CEO baton to long-time colleague Jennifer Wong (more on this below). Hill holds a 20% stake in the business, which, as a result of the company’s dual class share structure, gives him voting control in the business. The company has grown to 108 boutiques, with 68 in Canada and 41 in the United States, which deliver sales per square foot in the $1,400 realm, putting Aritzia in a league with the world’s premier brands.
Coming to America
Aritzia today looks eerily similar to another great Foolish pick of days gone by: David Gardner’s selection of Lululemon in 2010.
- Both started in Vancouver.
- Both are led by founders who are retail lifers.
- Both founders sold meaningful stakes to private equity to expand to the U.S.
- Both sport elite sales per square foot.
- Both were underpenetrated in the U.S.
- Lululemon in 2010: 82 U.S. stores, targeting 300 retail locations in North America.
- Aritzia in 2022: 38 U.S. stores, with 100 potential new locations identified (which, frankly feels ultra conservative).
Lululemon was able to successfully replicate its success in Canada in the United States, richly rewarding shareholders along the way. Today, it has over 300 locations in the U.S. alone.
We expect Aritzia to follow a similar path. Aritzia plans to focus all its new boutique openings in the U.S. in 2022, targeting seven to eight new stores, an acceleration from pre-pandemic plans for five to six openings. With a payback period of 12 to 24 months on each new store opening and a historical return on capital employed (ROCE) over 20%, these investments are highly accretive to the business. Furthermore, with 100 suitable locations identified, Aritzia can maintain this pace of store openings for the better part of a decade before needing to look outside North America.
Growing the Existing Base
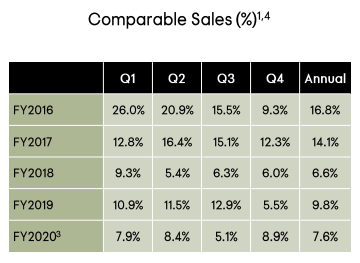
There’s more room to grow than just geographical expansion, however. With boutiques reporting comparable sales up 26% over pre-pandemic levels, the company is still driving significant value from its existing stores. In the U.S., net revenue is up 115% over pre-pandemic levels, and the U.S. client base has more than doubled in the last 12 months. To paraphrase Brian Hill, this company is becoming “more famous.” And when it comes to fashion, famous is good. Post-pandemic, we’re confident that same-store sales will return to prior trends of high single-digit annual growth.
We expect part of that growth to come from product expansion. In 2020, Brian Hill set a goal to double the company’s product offering by 2025. As of the most recent quarter, he believes they’re about halfway there as the result of introducing more inclusive sizes and a broader assortment of colours. Later in 2022, Aritzia plans to expand with a line of swimwear and intimates. Finally, like Lululemon, Aritzia plans to move more into menswear. Your Canadian investing team is eagerly awaiting this development. To augment its move into menswear, Aritzia purchased 75% of Reigning Champ, a Vancouver based men’s athletic wear brand, last year.
Part of this brand extension is made possible by Artizia’s incredible performance in e-commerce, which allows for a broader assortment than boutiques alone. E-commerce sales are up 162% compared to pre-pandemic, now making up more than a third of revenue. Although we expect to see e-commerce growth normalize post-pandemic, we anticipate e-commerce revenue to maintain a high double-digit growth rate (for context, e-commerce grew at a 36% CAGR pre-pandemic).
Pulling it all together, with stores growing 5-7% a year, returns on capital over 20%, high single-digit comp store sales, double-digit e-commerce growth, and a double-digit free cash flow margin on a debt-free balance sheet, Aritzia’s earnings and free cash flow are poised to be significantly higher in the years to come. We anticipate that the stock price will follow.
Risks and Considerations
Though we’d not call the shift in management a “risk,” it certainly warrants consideration. It’d be tough to imagine a better set up though for incoming CEO Jennifer Wong. As indicated, she’s worked alongside Brian Hill for 35 of Aritzia’s 38 years and has clearly been running much of the operation prior to this promotion, which appears more in title than anything else. Hill has his eyes set on a more strategic role, and given the opportunity in front of the company, this makes perfect sense.
Another consideration is one that is hard to escape for a lot of companies these days. Like so many others, supply chain woes have impacted the fashion industry—especially given the lead time required in the industry, Aritzia is facing inventory management and freight challenges. How this may impact the quarters directly in front of us is anyone’s guess. To be clear, this isn’t anything that’s going to keep us up at night, but it might be something the short-term/market timing crowd plays around with and lead to a noisier than usual stock price.
The overarching risk that applies to all things fashion is how fickle the industry can be. One day, these companies are expanding rapidly; the next, they’re not. Aritzia’s plans for expansion reflect conservatism, almost at the extreme—especially given the company’s financial position, but this is a dynamic we’re highly cognizant of and will monitor closely.
To make sure Aritzia stays on the right track, we’ll look for the company to maintain its elite sales per square foot, as it expands into the United States. Furthermore, we’ll be tracking comparable store sales to ensure existing stores are maintaining their relevance. If we see these metrics moving in the wrong direction, we’ll need to reassess whether Aritzia’s brand can maintain its relevance.
Bottom Line
We’ve an engaged founder, a track record of success in Canada, and a clear runway for growth, all of which has Aritzia well on its way to becoming the next great Canadian luxury brand. Pandemic restrictions are increasingly in the rear-view, and consumers are swapping their sweatpants and TV for high fashion and nightlife. Now could be a(nother) great time to add Aritzia to your portfolio.
Disclosure: Fool contributor Iain Butler has positions in Lululemon Athletica. The Motley Fool recommends ARITZIA INC and Lululemon Athletica.
Dream Industrial REIT
From Motley Fool Dividend Investor Canada Team
Dream Industrial owns a collection of industry property in Canada, the U.S., and Europe.
Why Buy:
- The industrial asset class benefits from the long-term trend towards e-commerce.
- The REIT has sold off sharply in recent weeks, offering an attractive entry point.
- Relative to its peers, Dream Industrial is in a favourable position in terms of leverage and liquidity.
| Headquarters | Toronto, Ontario |
| Website | www.dream.ca/industrial |
| Industry | Industrial REIT |
| Volatility | Medium |
| Market Cap | $1,197 |
| Cash/Debt | $441/$1,015 |
| Free cash flow (TTM) | $0.66 |
| Dividends (TTM) | $0.70 |
| Yield | 8.9% |
| Total Inside Ownership | 1% |
| Recent Price | $7.84 |
| Ideal Account Type | Non-registered |
| Limit Order (Yes/No) | Yes |
| TTM = Trailing 12 Months | |
| Dollar amounts in millions except recent price. | |
| Data as of March 18, 2020 | |
Points to Consider…
- Dream Industrial REIT’s monthly distribution is not eligible for the federal Dividend Tax Credit. Approximately 70% of the distribution is considered a “return of capital” and 30% “other income,” making a taxable, non-registered account worth considering for those looking for the most tax-efficient option.
- Other income will be taxed at your marginal rate if this stock is held in a non-registered account. The return of capital will not be taxed until those funds are eventually withdrawn from the account. A non-registered account may be more tax-efficient over the long haul but will involve tracking your own cost basis over time. A registered account, such as your RRSP, may be the most desirable option for investors looking for the simplest option (no tracking necessary).
- The company offers a dividend-reinvestment plan (DRIP). You can learn about it here.
The information regarding tax treatment in this piece is informational only and not intended as tax advice. For information on your individual tax situation and how it could be affected by dividends, please consult your tax advisor.
You’ll often hear us use the phrase “markets hate uncertainty” around the Motley Fool. This week, we’ve seen that play out on a broad scale across markets as investors watch stocks whipsaw lower. The S&P/TSX index has fallen to levels last seen in 2012, and to some it feels like we’re just getting started. For those of you looking at large losses, I feel your pain and we will work through each of those situations.
Handicapping the length of time the coronavirus takes to work its way through the system is an incredibly difficult exercise. That’s certainly causing a ton of uncertainty for businesses and investors. Also, it’s difficult to tell how much exposure a company truly has to being impaired until we get a better handle on an accurate timeframe.
We’ve seen a lot of pain on the Dividend Investor scorecard over the past couple weeks. Real estate investment trusts (REITs) got hit particularly hard this week. For instance, we watched the valuations of some of our favourite industrial REITs take a big hit. Granted, the space had become a popular asset class within the REIT universe so we came into this period with some relatively rich valuations. Those premiums are gone today. For instance, today’s re-rec, Dream Industrial REIT (TSX:DIR.UN), trades at just 12 times trailing AFFO. This compares to a multiple of multiple of around 20 times just a few weeks ago. Given the long-term tailwinds driving demand for industrial space, industrial REITs have enjoyed multiples in the 20-plus range for some time.
Right now, we’re all focused on the coronavirus and its impact today, and rightfully so. That said, I think the demand for well-located industrial property will be a story that comes back quickly and lasts a long time. The e-commerce story has a nice, long-term tailwind behind it. This makes the industrial REITs compelling right now, given their potential to bounce back relatively quickly once life gets back to normal. For today’s re-rec, we sought out Dream Industrial due in large part to its financial flexibility. They’ve done a good job reducing leverage, and re-positioning the REIT to grow in high-yield markets.
The Fundamentals
Since our original recommendation in January of 2019, Dream Industrial REIT has been busy diversifying its geographic markets and lowering its leverage. Over the past couple years, the REIT has added two new markets by entering the U.S. in 2018 and the Netherlands last year. This has helped reduce the REIT’s overall exposure to markets in Alberta, shifting its focus in Canada towards Ontario and the Greater Toronto Area (GTA).
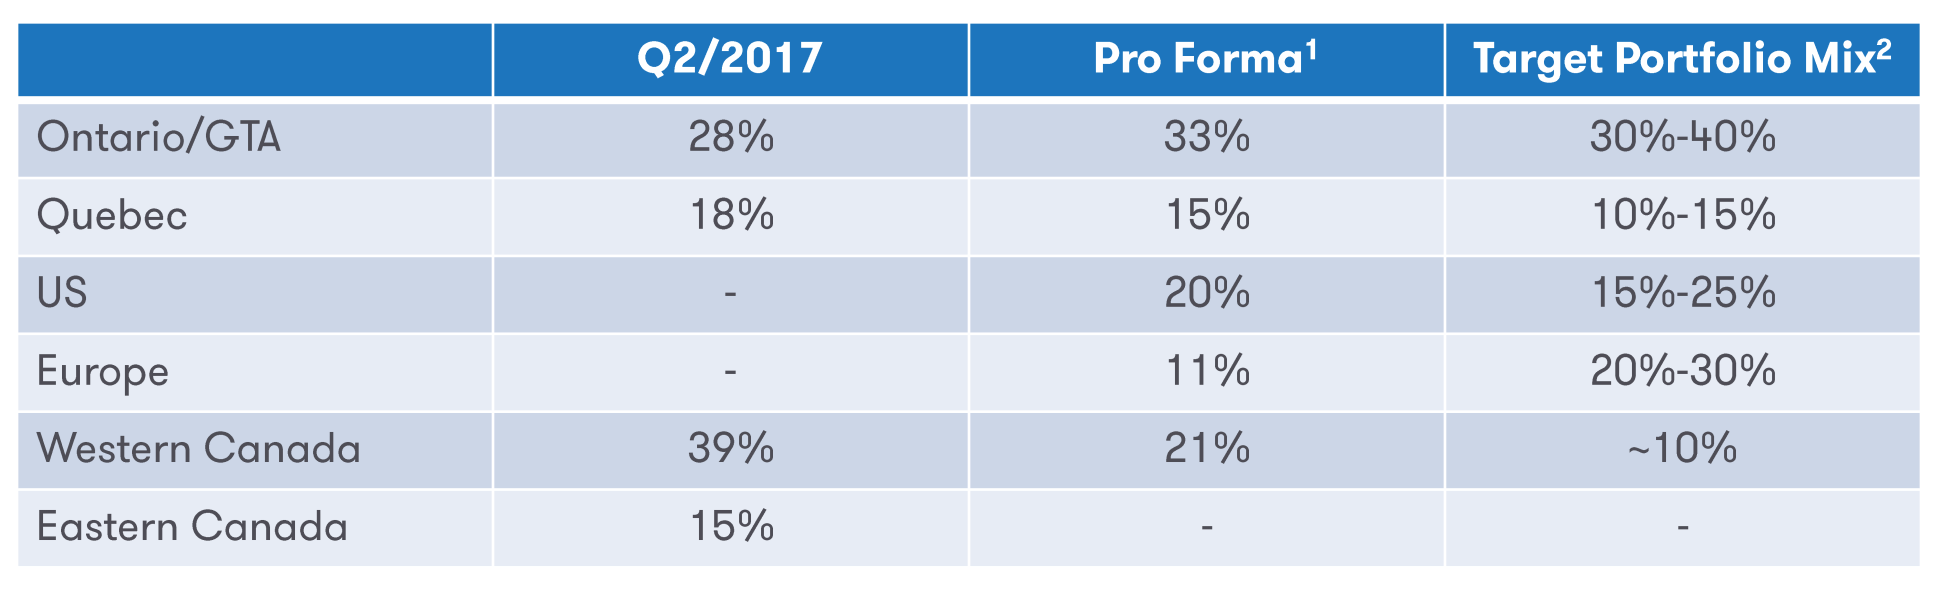
The REIT has also done a good job of reducing risk over the past couple years by increasing its proportion of unencumbered assets. As you’ll see in the chart below, Dream has lowered its leverage ratio from the mid-40% range to a low of 24.9% as of the end of fiscal 2019. The REIT has been active with some asset purchases subsequent to quarter-end, but its leverage ratio remains unusually low for a Canadian REIT at around 35%. For most REITs, you’ll find a leverage ratio in the 45% to 50% range. This was the case with Dream Industrial until management began to strategically lower its ratio in 2017.
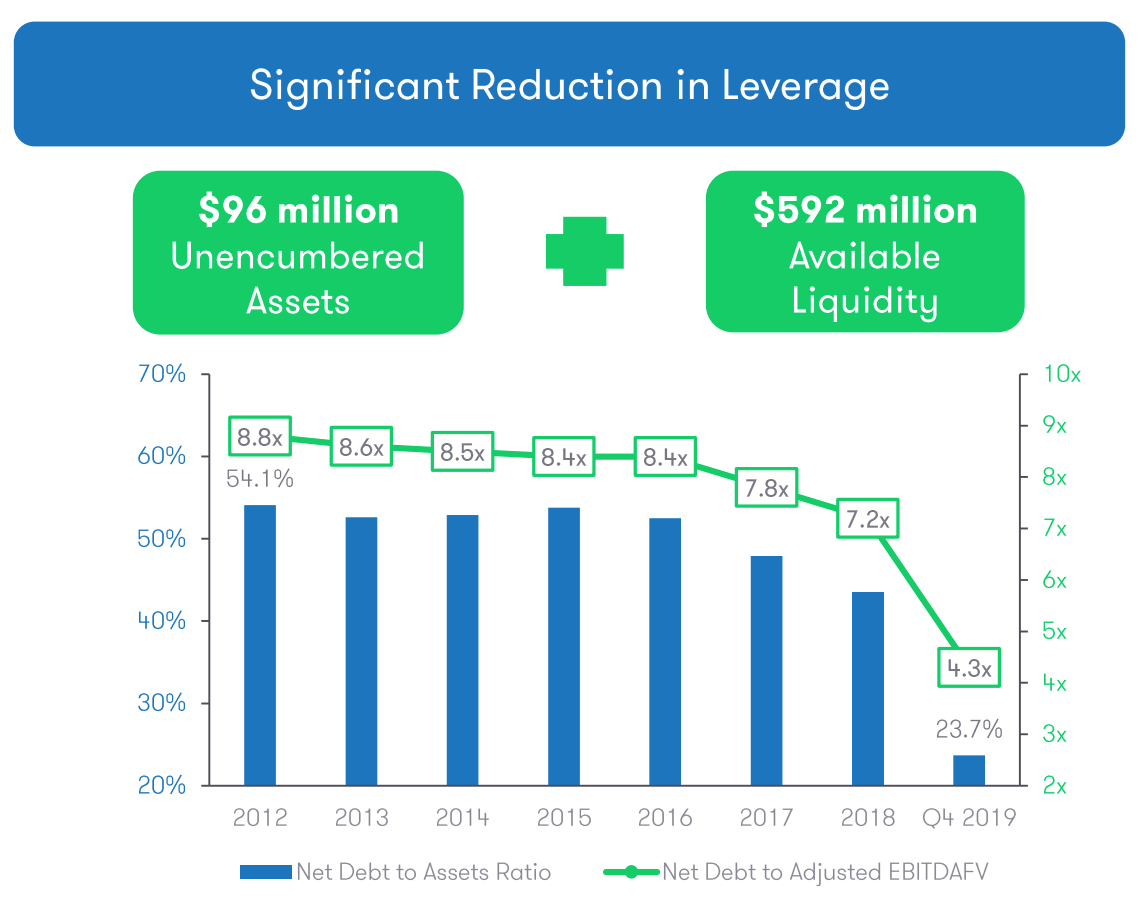
The low leverage will be a key differentiator for Dream Industrial when compared with its peers in the REIT universe. This will play a larger role from a defensive perspective if our economies falter for longer than expected. REITs operating at leverage ratios of around 50% will have less flexibility if economic conditions fail to return to normal in the near term. However, if we’re able to move past the coronavirus outbreak in a reasonable timeframe, Dream is positioned to go on the offence and make accretive acquisitions in various markets to further reduce its overall exposure to Western Canada.
Dream Industrial’s property portfolio is comprised of 263 industrial properties with a total of around 26.5 million square feet of space. Overall occupancy has remained relatively steady for the REIT at around 95%. The REIT’s tenant base is well diversified with over 1,000 tenants. Dream’s largest tenant represents just 3.9% of total rental income, and its top 10 tenants represent around 18%. The REIT has already renewed or re-leased half of its lease expiries for 2020. That leaves roughly 7% of the total portfolio still up for renewal this year.
Why Buy
Another factor that helps distinguish Dream Industrial from its peers is its ability to target higher-yielding assets as it expands. For instance, the e-commerce market is less mature and more fragmented in the Netherlands, allowing Dream Industrial to acquire assets at better prices than the GTA. With interest rates back to abnormally low levels, and Dream’s ability to tap into the debt markets in Europe, the REIT has a great opportunity to make accretive acquisitions.
The industrial market has simply been very pricey in Ontario, and the GTA as cap rates have been stuck at record lows for some time now. The exposure to these core markets is great given the strong fundamentals, but it makes it tough to source accretive acquisitions. By focusing on acquisitions in the U.S. and Europe, Dream has a favourable opportunity to drive cash flow growth on a per-unit basis. In Europe, Dream Industrial has key personnel from former recommendation Dream Global REIT pursuing opportunities and a partner in the U.S. to do the same.
As mentioned earlier, Dream Industrial’s relatively low leverage ratio sets the REIT up to remain flexible during these turbulent times. It can hold onto its cash and wait for the dust to settle or continue to lower its exposure to Western Canada and grow per-unit cash flow by being more aggressive. This attribute is difficult to replicate right now for its peers.
The significant decline in Dream Industrial’s unit price, along with a host of other REITs, has certainly caught our attention. After receiving a haircut from the market of around 45% in the past couple weeks, Dream industrial now trades for just 12 times trailing cash flow or adjusted funds from operations (AFFO).
The Distribution
Given the rapid decline in Dream Industrial’s unit price, the REIT’s distribution yield has ballooned to nearly 9%. While Dream Industrial does have some balance sheet flexibility relative to its peers, its payout ratio is similar to most at around 100%. Admittedly, this is not a desirable situation at a time like this, but the REIT does have the liquidity to cover an elevated payout ratio this year. In addition, as capital is put to work, AFFO per unit will receive a boost.
| C$ | 2016 | 2017 | 2018 | 2019 | 2020E |
| AFFO per unit | $0.79 | $0.81 | $0.72 | $0.66 | $0.70 |
| Distributions per unit | $0.70 | $0.70 | $0.70 | $0.70 | $0.70 |
| AFFO payout ratio | 88.6% | 86.4% | 97.2% | 106.1% | 100.0% |
Source: Company filings; analyst estimates.
If conditions deteriorate for an extended period of time, Dream could trim its distribution levels back to around 80%. While that sounds scary, it’s important to also consider that the REIT has already sold-off by around 50% over the past couple weeks. With that said, at this stage I think Dream Industrial will keep its monthly distribution intact until we see what the next several weeks have in store regarding the coronavirus threat.
Risks
We are certainly in a period of heightened risk. We’ve had our fair share of recommendations take a pounding so far, including several companies that were forced to cut their dividends.
For Dream Industrial, its weakest markets will likely remain in Western Canada. Energy markets are likely to remain under pressure for some time, so having the flexibility to reduce its overall exposure to this market is important.
Looking at the portfolio at large, vacancy rates could very well push up here in the near term, especially if our economies remain in decline/neutral for longer than expected. Unfortunately, at this stage we’re still in a wait-and-see mode regarding the eventual impact businesses will suffer. By and large, companies will not want to give up their warehouse, distribution, and logistics assets. If vacancies do pickup, the low availability rates in several of the REIT’s target markets should help support Dream’s task of re-leasing property.
We’ve already covered Dream’s balance sheet quite a bit. Besides its relatively low leverage ratio, only 4% of its outstanding debt is scheduled to mature in 2020. Meanwhile, it should feel some relief from lower rates as the REIT executes on its ongoing strategy to lower its borrowing costs. This involves taking advantage of ultra-low rates and shifting its mortgages to Europe. When markets return to normal, this will be a lever Dream Industrial can use for years to come thanks to its entrance into Europe.
Foolish Bottom line
It’s not an easy time to be a long-term investor. Stock market valuations are taking hits from all directions. We’ve waited for valuations to soften up for quite some time, and we’re surely getting more than we bargained for during the current downturn.
During times like this, it helps to expand your investing time horizon if you find yourself in a position to do so. Markets have a way of overshooting in both directions, and often bounce back sooner than we anticipate. I remember during the financial crisis when it felt like it was never going to end. Most look back at that period as an excellent buying opportunity, and I’m optimistic that we’ll look back at this period as one too. It doesn’t feel like it now, as the days are drag out and the losses mount up, but it never does during times like this.
Disclosure: Iain Butler owns shares of Brookfield Asset Management. Jim Gillies owns shares of Brookfield Asset Management. David Gardner owns shares of Canadian National Railway. The Motley Fool owns shares of Berkshire Hathaway.