
This year has not been the best for investors. Some have done well if they own top-performing stocks in U.S. markets, which would be Apple Inc. and Amazon.com, Inc. on the NASDAQ exchange, or Boeing Co on the NYSE.
How about the TSX?
We’re more than halfway through 2017 and, given geopolitical concerns, calls to repeal NAFTA, and a weak energy sector, the TSX might limp to the end of year. New or seasoned veterans might benefit from a portfolio overview. Here are some ideas to consider.
Using screening tools is one way to help with stock picking. The price-to-earnings ratio (P/E) is very popular because it tells you how much of a mark-up you have to pay for a company’s earnings, which is why some describe P/E as a multiple. A company that does not have earnings means it does not have a P/E … generally a sign to move on. Operating earnings over operating sales is another useful metric (also known as operating earnings margin). This margin reflects a company’s performance and its true business costs, which is to say how well the company turns sales into earnings.
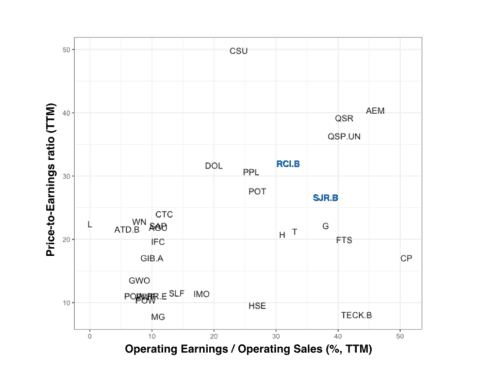
The chart shows a select number of TSX companies and where they sit in terms of P/E and operating earnings margin. Companies with low P/E and high operating earnings margin, in the bottom right section, would be considerable favourable. Two companies are highlighted in blue. Notice that Shaw Communications Inc. (TSX:SJR.B)(NYSE:SJR) is in a better location on the chart compared to Rogers Communications Inc. (TSX:RCI.B)(NYSE:RCI). This suggests investors are, on average, willing to pay a higher multiple for Rogers, even though it does not perform as well as Shaw.
Leave the guessing to the pros: buying index funds
Studies show it is difficult for individual investors to consistently beat the overall market. This means it is often better to buy a small piece of every stock than buying your favourite few. How do you buy the market? You select from one of many exchanged-traded funds (ETFs). Despite a very slow start in the early 1990s, ETFs have been eating into portfolios over the last few years at a rampant pace. (The number of ETFs is actually getting a little out of control…)
In the U.S., the three largest ETF are SPDR S&P 500 ETF (NYSEARCA:SPY), iShares Core S&P 500 ETF (NYSEARCA:IVV), Vanguard Total Stock Market ETF (NYSEARCA:VTI). SPY and IVV track the top S&P 500 companies. SPY is worth one-quarter of a trillion dollars and has nearly one billion shares.
VTI holds 3,613 companies. How is that for diversification?! Since inception in 2001, the VTI index has an average annual return of 6.7%. That’s not a bad return for something you never need to check and pay a measly management fee of 0.04% on your investment.
Fortunately, there are solid options on the TSX. These include:
- A total market ETF called VANGUARD US TOTAL MKT IDX ETF CAD HDG (TSX:VUS)
- An index of the top 60 TSX companies called iShares S&P/TSX 60 Index ETF (TSX:XIU)
- An index covering companies in Europe, Australasia, and the far east called VANGUARD FTSE DEV AC EX US IDX CAD HEG (TSX:VEF)
What does an ETF investment plan look like?
The plan is simple. Say you save $5,000 every year and want to invest it in a cash, RRSP, RESP, or TFSA. Each year, starting in September, you buy $5,000 worth of your favourite ETF shares. Set it and forget it. Repeat each year. The least amount of thinking required is to buy SPY.
Here’s what it would look like if you started in 2011:
| Purchase Price ($) | Trading Fee ($) | Number of Shares | Investment Amount ($) | Current Value ($) | CAGR (%) | |
| Sept 2011 | 118 | 10 | 42 | 5,000 | 10,339 | 12.9 |
| Sept 2012 | 144 | 10 | 35 | 5,000 | 8,472 | 11.1 |
| Sept 2013 | 164 | 10 | 30 | 5,000 | 7,439 | 10.4 |
| Sept 2014 | 201 | 10 | 25 | 5,000 | 6,070 | 6.7 |
| Sept 2015 | 192 | 10 | 26 | 5,000 | 6,354 | 12.7 |
| Sept 2016 | 218 | 10 | 23 | 5,000 | 5,596 | 11.9 |
| Portfolio today | 244 | 60 | 123 | 30,000 | 44,210 | 11.0 |
Assuming a $10 trading fee means you pay $60 to buy a total of 123 shares over six years. You’ve put in $30,000, which is the investment book value. And the market value is $44,210. The average compound annual return percentage is 11%. As long as you can be disciplined and stick to the schedule, it is pretty easy money.
There is risk with this plan since there is no guarantee of a stable return, but this approach keeps you from having to pick stock winners. Investors that enjoy buying and selling stocks can allocate this ETF model according to their needs.
Stay the course in your investment journey. Stay Foolish.