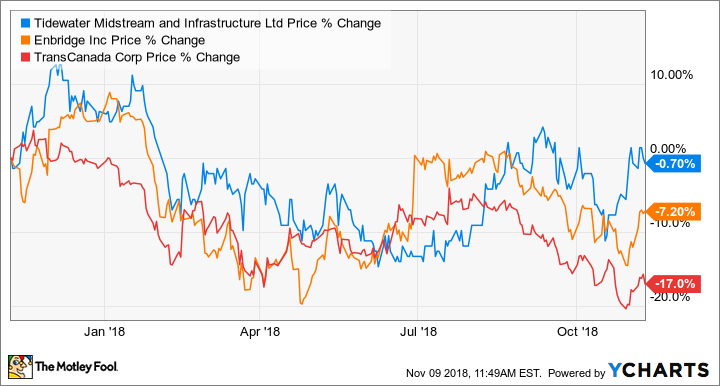
In the last year, energy infrastructure stocks have been weak. Compared to its much bigger peers, such as Enbridge (TSX:ENB)(NYSE:ENB) and TransCanada (TSX:TRP)(NYSE:TRP), Tidewater Midstream & Infrastructure (TSX:TWM) stock has fared much better, as shown in the chart below.
TWM data by YCharts. One-year price comparison between the stocks of Tidewater, Enbridge, and TransCanada.
One reason for the weakness in the stocks is the high debt levels that are inherent in their businesses. Increasing interest rates will make it more costly to run the businesses.
Additionally, sometimes these stocks are viewed as bond proxies because of their relatively high dividend yields. Higher interest rates will make fixed-income investments more attractive, and these investments will compete with “bond proxy” stocks.
Let’s compare the debt levels of the three stocks and the safety of their dividends. Here are some debt ratio comparisons using the information from their latest quarterly reports. The lower the ratios, the less leveraged the companies are.
Which company is more leveraged?
At the end of Q2, Tidewater had a debt-to-equity ratio of about 1.32. At the end of Q3, Enbridge and TransCanada had debt-to-equity ratios of about 1.4 and 2.15, respectively.
At the end of Q2, Tidewater had a debt-to-EBITDA ratio of about 3.76. At the end of Q3, Enbridge and TransCanada had debt-to-EBITDA ratios of about 4.7 and about 7.8, respectively.
At the end of Q2, Tidewater had a debt-to-asset ratio of about 0.57. At the end of Q3, Enbridge and TransCanada had debt-to-asset ratios of about 0.56 and about 0.68, respectively.
The debt ratios indicate that TransCanada is the most leveraged, followed by Enbridge and then Tidewater. Notably, both Enbridge and TransCanada have an investment-grade S&P credit rating of BBB+, while Tidewater is probably too small a company to be rated.
It makes sense that Tidewater is the least leveraged, because it’s a small-cap company and needs a more solid balance sheet to have more wiggle room in case it runs into challenges and needs to raise capital quickly.

Dividend safety
One way to compare the relative safety of dividends from companies is to look at their payout ratios based on earnings. The lower the payout ratio, the better.
Tidewater recently paid out less than 69% of its earnings as dividends. Enbridge and TransCanada recently paid out just over 100% and 99%, respectively, of their earnings as dividends.
A better metric for comparing the relative safety of dividends from energy infrastructure companies is to look at how well their cash flows cover their dividends. The higher the coverage ratio, the better.
Tidewater’s recent dividend coverage was 4.3. Enbridge and TransCanada’s recent dividend coverage ratios were 2.5 and 4.7, respectively.
Based on these metrics, Tidewater’s dividend is the safest, followed by TransCanada.
Investor takeaway
Enbridge and TransCanada are popular dividend stocks with dividend-growth track records of about two decades. They currently offer dividend yields of about 6.1% and 5.4%, respectively. Between the two, Enbridge is less leveraged but offers a dividend that has weaker coverage. Will you choose a safer investment or a safer dividend?
As a much smaller company, Tidewater offers a solid balance sheet and strong coverage on its dividend, but it doesn’t have a history of increasing dividends. It currently yields about 2.8%.


