


Welcome to a weekly series where I break down and compare some of the most popular exchange-traded funds (ETFs) available to Canadian investors!
Canadian investors favouring the most hands-off, passive approach to investing can eschew a hand-picked portfolio of stocks and bonds for an all-in-one asset allocation ETF. Both Vanguard and BlackRock provide a set of tickers for these types of ETFs.
Today, we’ll be looking at the 100% stocks version, otherwise known as the “all-equity” ETF portfolio, suitable for investors with a high risk tolerance. Up for consideration are Vanguard All-Equity ETF Portfolio (TSX:VEQT) and iShares Core Equity ETF Portfolio (TSX: XEQT).
Image source: Getty Images
VEQT vs XEQT: fees
The fee charged by an ETF is expressed as the management expense ratio (MER). This is the percentage that is deducted from the ETF’s net asset value (NAV) over time, calculated on an annual basis. For example, an MER of 0.50% means that for every $10,000 invested, the ETF charges a fee of $50 annually.
VEQT has an MER of 0.24%, compared to XEQT’s MER of 0.20%. The difference is minuscule (a difference of $4 on a $10,000 portfolio), but if we had to pick a winner, it would be XEQT.
VEQT vs XEQT: size
The size of an ETF is very important. Funds with small assets under management (AUM) may have poor liquidity, low trading volume, high bid-ask spreads, and more risk of being delisted due to lack of interest.
VEQT currently has AUM of $2.24 billion, whereas XEQT has AUM of $927 million. Although both are sufficient for a buy-and-hold investor, VEQT is clearly the more popular one.
VEQT vs XEQT: holdings
Both ETFs here are considered “funds of funds,” in that their underlying holdings are not stocks, but rather other ETFs. This makes sense in that XEQT and VEQT are intended to be all-in-one portfolios.
XEQT chooses to allocate approximately 45% to the U.S. stock market, 25% to the Canadian stock market, 25% to the developed international stock market, and 5% to the emerging international stock market.
VEQT chooses to allocate approximately 43% to the U.S. stock market, 31% to the Canadian stock market, 19% to the developed international stock market, and 7% to the emerging international stock market.
VEQT vs XEQT: historical performance
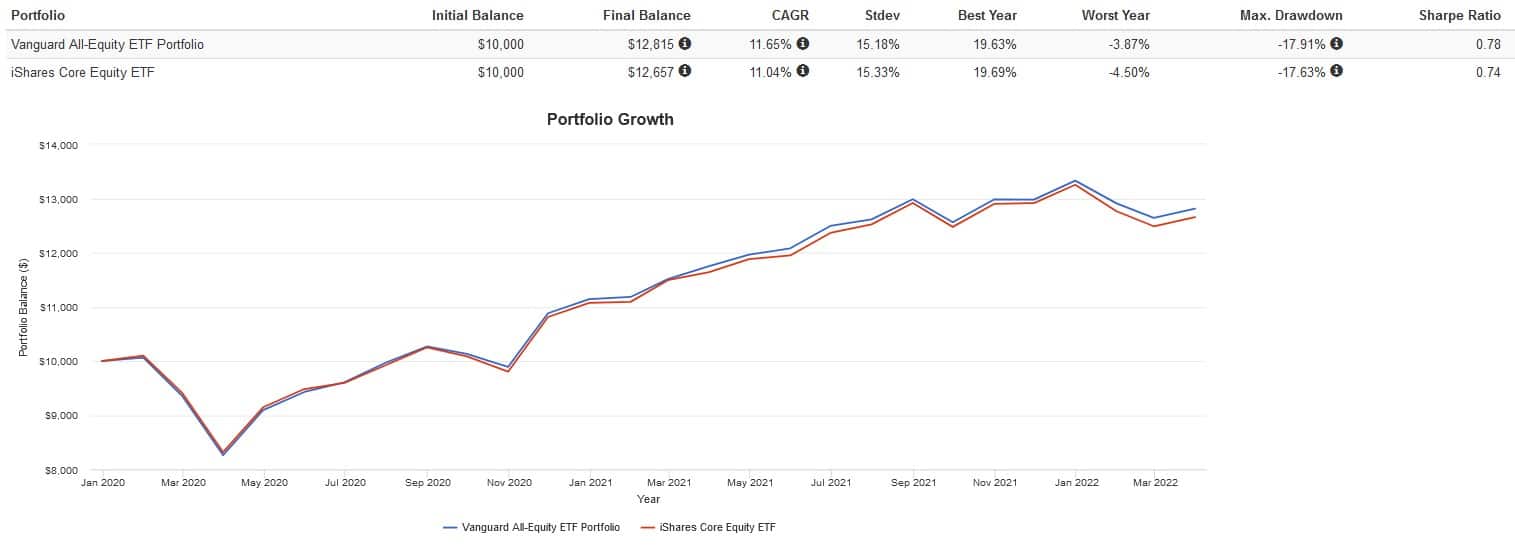
Both funds are quite new, so their performance history is rather limited. Nonetheless, a backtest is useful for assessing their tracking error and relative performance.
A cautionary statement before we dive in: past performance is no guarantee of future results, which can and will vary. The portfolio returns presented below are hypothetical and backtested. The returns do not reflect trading costs, transaction fees, or taxes, which can cause drag.
Here are the trailing returns from 2020 to present:
Here are the annual returns from 2020 to present:

Both ETFs have very similar performance. VEQT had slightly higher returns and volatility, which I attribute to the outperformance of Canadian stocks in 2020 and 2022, which it holds in higher proportions compared to XEQT. However, I do expect their performance to be virtually identical in the long run.
The Foolish takeaway
If I had to choose one ETF to buy and hold, it would be XEQT. Despite the lower AUM, the 0.04% difference in MER could make a big difference over long periods of time with a large portfolio. Both funds have roughly the same holdings with good diversification, although XEQT is a bit more U.S.-heavy. Still, if you’re partial to Vanguard, VEQT is a fantastic choice as well.