Welcome to a series where I break down and compare some of the most popular exchange-traded funds (ETFs) available to Canadian investors!
Investors priced out of Canada’s red-hot real estate market can make do with buying shares of various real estate investment trusts (REITs). Both BlackRock and BMO Global Asset Management provide a set of low-cost, high-liquidity ETFs that offer exposure to a portfolio of REITs from all sectors, including residential, office, industrial, healthcare, and retail.
The two tickers up for consideration today are iShares S&P/TX Capped REIT ETF (TSX:XRE) and BMO Equal Weight REIT ETF (TSX:ZRE). Which one is the better option? Keep reading to find out.
XRE vs. ZRE: Fees
The fee charged by an ETF is expressed as the management expense ratio (MER). This is the percentage that is deducted from the ETF’s net asset value (NAV) over time and is calculated on an annual basis. For example, an MER of 0.50% means that for every $10,000 invested, the ETF charges a fee of $50 annually.
XRE has an MER of 0.61%, identical to ZRE. The ETFs are therefore tied when it comes to their fees, with both costing you $61 annually on a $10,000 portfolio. This is slightly more expensive than holding a portfolio of REITs directly, but it does save you the trading cost of re-balancing.
XRE vs. ZRE: Size
The size of an ETF is very important. Funds with small assets under management (AUM) may have poor liquidity, low trading volume, high bid-ask spreads, and more risk of being delisted due to lack of interest.
XRE has attracted AUM of $1.26 billion, whereas ZRE has AUM of $780 million. Although both are sufficient for a buy-and-hold investor, XRE is currently the more popular ETF among Canadian investors.
XRE vs. ZRE: Holdings
XRE tracks the S&P/TSX Capped REIT Index, which tracks the performance of 19 TSX-listed REITs, with each capped at a max weight of 25%. The top five holdings of XRE include Canadian Apartment REIT, RioCan REIT, Granite REIT, Allied Properties REIT, and Choice Properties REIT, which together comprise around 48% of the ETF due to their large market caps.
ZRE tracks the Solactive Equal Weight Canada REIT Index, which tracks the performance of TSX-listed REITs. ZRE is equally allocated between 23 holdings at around 4% each. ZRE contains the same top five holdings as XRE does but at much lower weights. Therefore, small market cap REITs are afforded the same allocation as larger ones for better diversification.
Investors usually hold REITs for the passive-income potential, so we also need to examine their distribution yield. Currently, ZRE pays a yield of 3.87% vs. XRE at 3.41%. While both are respectable, the win goes to ZRE on this one.
XRE vs. ZRE: Historical performance
A cautionary statement before we dive in: past performance is no guarantee of future results, which can and will vary. The portfolio returns presented below are hypothetical and backtested. The returns do not reflect trading costs, transaction fees, or taxes, which can cause drag.
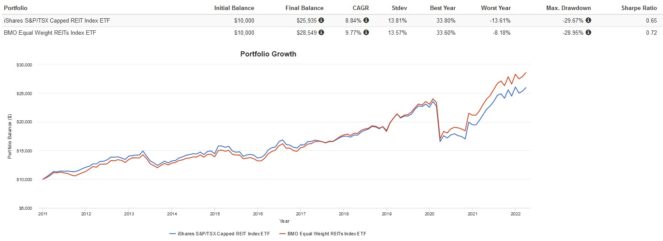
Here are the trailing returns from 2011 to present:
Here are the annual returns from 2011 to present:
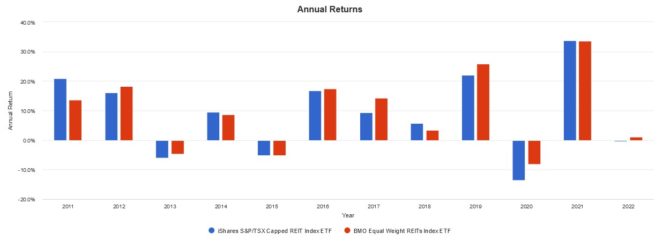
ZRE has outperformed XRE over the last decade. I attribute this to ZRE’s equal weighting, which reduced the risk of a single large holding tanking its performance. XRE is way too concentrated with 48% of its holdings in just five REITs, which makes it more volatile, especially during crashes.
The Foolish takeaway
If I had to choose one ETF to buy and hold, it would be ZRE. Both ETFs have identical MERs, XRE has more AUM, but when it comes to holdings, I feel more comfortable buying an equal-weighted ETF. When I buy a sector-specific ETF, I want to actually own the sector and not just a few select companies. For this reason, ZRE is my pick for betting on the TSX REIT sector.