Welcome to a series where I break down and compare some of the most popular exchange-traded funds (ETFs) available to Canadian investors!
An allocation to ex-U.S. and Canadian equities is sensible for most investors. Developed international markets like Europe and Asia-Pacific contain some great stocks that make good long-term holds. Thankfully, both Vanguard and BlackRock provide a set of low-cost, high-liquidity ETFs that offer exposure.
The two tickers up for consideration today are Vanguard FTSE Developed All Cap ex North America Index ETF (TSX:VIU) and iShares Core MSCI EAFE IMI Index ETF (TSX:XEF). Which one is the better option? Keep reading to find out.

Image source: Getty Images
VIU vs. XEF: Fees
The fee charged by an ETF is expressed as the management expense ratio (MER). This is the percentage that is deducted from the ETF’s net asset value (NAV) over time and is calculated on an annual basis. For example, an MER of 0.50% means that for every $10,000 invested, the ETF charges a fee of $50 annually.
VIU has a MER of 0.23%, compared to XEF at 0.22%. For a $10,000 portfolio, the difference works out to around $1 per year, which is miniscule and not worth fretting over. Still, if we had to pick a winner, the advantage goes to XEF.
VIU vs. XEF: Size
The size of an ETF is very important. Funds with small assets under management (AUM) may have poor liquidity, low trading volume, high bid-ask spreads, and more risk of being delisted due to lack of interest.
VIU has attracted AUM of $2.7 billion, whereas XEF has AUM of $5 billion. Although both are sufficient for a buy-and-hold investor, XEF is currently the more popular ETF among Canadian investors.
VIU vs. XEF: Holdings
VIU tracks the FTSE Developed All Cap ex North America Index, which holds a total of 3,914 mostly large-cap stocks. In terms of geographical exposure, VIU is approximately 58% Europe and 40% Asia-Pacific, with Japan, the U.K., France, Switzerland, Australia, Germany, and South Korea comprising 22%, 15%, 9%, 9%, 8%, 7%, and 5%, respectively.
XEF tracks the MSCI EAFE Investable Market Index, which holds a total of 2,605 mostly large-cap stocks. In terms of geographical exposure, Japan dominates at 23%, followed by the U.K. at 16%, France at 10%, Switzerland at 9%, Australia at 8%, and Germany at 8%.
VIU vs. XEF: Historical performance
A cautionary statement before we dive in: past performance is no guarantee of future results, which can and will vary. The portfolio returns presented below are hypothetical and backtested. The returns do not reflect trading costs, transaction fees, or taxes, which can cause drag.
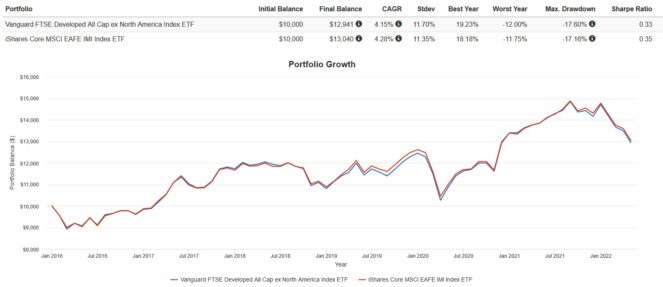
Here are the trailing returns from 2016 to present:
Here are the annual returns from 2016 to present:
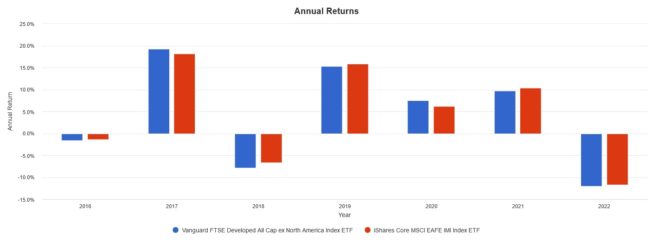
Both ETFs had virtually identical performance, with some variation year by year due to tracking error. Over the long run, I expect returns and risk to be indistinguishable.
The Foolish takeaway
Given that both ETFs perform more or less identically and have sufficient AUM, I would pick the one with the lower MER, which would be XEF. However, if you idolize Jack Bogle and love Vanguard, VIU is a good pick, too.