Welcome to a series where I break down and compare some of the most popular exchange-traded funds (ETFs) available to Canadian investors!
Canadian investors taking a passive approach to buying U.S. stocks generally default to the tried-and-true S&P 500 Index. Both Vanguard and Horizons provide a set of low-cost, high-liquidity, CAD-denominated ETFs for tracking the S&P 500.
The two tickers up for consideration today are Vanguard S&P 500 Index ETF (TSX:VFV) and Horizons S&P 500 Index ETF (TSX:HXS). Which one is the better option? Keep reading to find out.
VFV vs. HXS: Fees
The fee charged by an ETF is expressed as the management expense ratio (MER). This is the percentage that is deducted from the ETF’s net asset value (NAV) over time and calculated on an annual basis. For example, an MER of 0.50% means that for every $10,000 invested, the ETF charges a fee of $50 annually.
VFV has an MER of 0.09% compared to HXS at 0.10%, but HXS also has an additional 0.10% swap fee embedded. The difference here is around $11 on a $10,000 portfolio, which can add up over the long term, especially as your portfolio gets larger. The clear winner here is VFV.
VFV vs. HXS: Size
The size of an ETF is very important. Funds with small assets under management (AUM) may have poor liquidity, low trading volume, high bid-ask spreads, and more risk of being delisted due to lack of interest.
VFV currently has AUM of $6.75 billion, whereas HXS has AUM of $3.49 billion. Although both are more than sufficient for a buy-and-hold investor, VFV is clearly the more popular one.
VFV vs. HXS: Holdings
VFV is a “fund of funds” in that its U.S.-domiciled cousin, Vanguard S&P 500 Index ETF (VOO), is its sole underlying holding. VOO then holds the 502 stocks in the S&P 500 that VFV tracks. Essentially, VFV can be thought of as a CAD-denominated “wrapper” that holds VOO for Canadian investors.
HXS is unique. Rather than hold another ETF or stocks, HXS buys a derivative called a total-return swap from multiple big Canadian bank counterparties to achieve exposure to the S&P 500. I previously dived deep into its mechanics in this article, so make sure you give it a read.
VFV vs. HXS: Historical performance
A cautionary statement before we dive in: past performance is no guarantee of future results, which can and will vary. The portfolio returns presented below are hypothetical and backtested. The returns do not reflect trading costs, transaction fees, or taxes, which can cause drag.
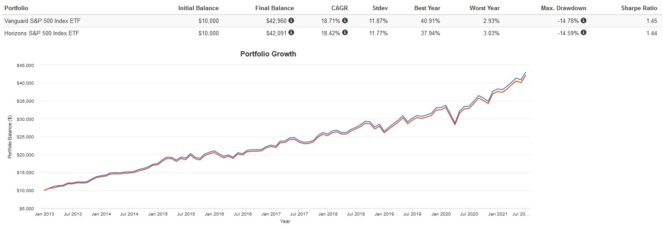
Here are the trailing returns from 2013 to present:
Here are the annual returns from 2013 to present:
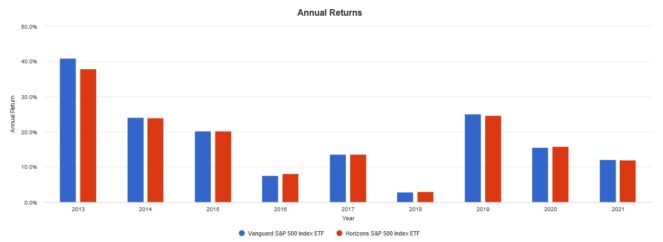
Both ETFs have very similar performance, but VFV pulls ahead over time. I attribute this to its lower MER, which resulted in a lower drag vs. HXS.
The Foolish takeaway
If I had to pick and choose one ETF to buy and hold, it would be VFV. A lower MER, higher AUM, and more “vanilla” structure makes it more suitable as a long-term hold vs. HXS. Still, there is a very good reason to use HXS over VFV: if you’re investing in a taxable account, holding HXS can allow you to avoid paying dividend tax and defer capital gains tax.