


Welcome to a series where I break down and compare some of the most popular exchange-traded funds (ETFs) available to Canadian investors!
The benchmark S&P 500 Index is down heavily year to date as a result of rising interest rates and high market volatility. The current correction could be a great buying opportunity though. Thankfully, Vanguard, Blackrock, and BMO Global Asset Management provide a set of low-cost, high-liquidity ETFs that offer exposure to the S&P 500.
The three tickers up for consideration today are Vanguard S&P 500 Index ETF (TSX: VFV), iShares Core S&P 500 ETF (TSX: XUS), and BMO S&P 500 Index ETF (TSX: ZSP). Which one is the better option? Keep reading to find out.
VFV vs. ZSP vs. XUS: Fees
The fee charged by an ETF is expressed as the management expense ratio (MER). This is the percentage that is deducted from the ETF’s net asset value (NAV) over time and is calculated on an annual basis. For example, an MER of 0.50% means that for every $10,000 invested, the ETF charges a fee of $50 annually.
Both VFV and ZSP have an MER of 0.09%, making them tied on this front, while XUS has an MER of 0.10%. For a $10,000 portfolio, either ZSP or VFV will cost you around $9 per year to hold versus $10 for XUS. All are extremely cheap, but if we had to split hairs here, the nod goes to VFV or ZSP.
VFV vs. ZSP vs. XUS: Size
The size of an ETF is very important. Funds with small assets under management (AUM) may have poor liquidity, low trading volume, high bid-ask spreads, and more risk of being delisted due to lack of interest.
VFV has attracted AUM of $6.6 billion, ZSP has $9.8 billion, and XUS has 4.4 billion. Although all are sufficient for a buy-and-hold investor, ZSP is currently the more popular ETF among Canadian investors.
VFV vs. ZSP vs. XUS: Holdings
All three ETFs track the S&P 500 Index, which is comprised of the largest 500 companies listed on U.S. exchanges, diversified across various sectors like technology, health care, financials, communications, consumer staples, consumer discretionaries, industrials, and energy. The index is widely seen as a barometre for overall U.S. stock market performance.
All three ETFs therefore hold the same underlying stocks, but in different ways. ZSP elects to actually purchase all 500 of the index’s stocks in their corresponding proportions. VFV and XUS simply holds their U.S. ETF counterpart as a “wrapper.” The structure doesn’t make a discernible difference for investors, but it’s good to understand.
Something else to note here is that none of these ETFs are currency hedged. The underlying stocks of the S&P 500 trade in USD. When you buy a Canadian ETF, the difference between the CAD-USD pair can affect the value of the Canadian ETF beyond the price movement of the underlying stocks.
ETFs that are unhedged accept this phenomenon. What that means is if the U.S. dollar appreciates, the ETF will gain additional value. Conversely, if the Canadian dollar appreciates, the ETF will lose additional value. This introduces extra volatility that could affect your overall return.
This has been the case with VFV, ZSP, and XUS, with the rising U.S. dollar causing all three to beat their U.S. ETF counterparts over the last decade.
VFV vs. ZSP vs. XUS: Historical performance
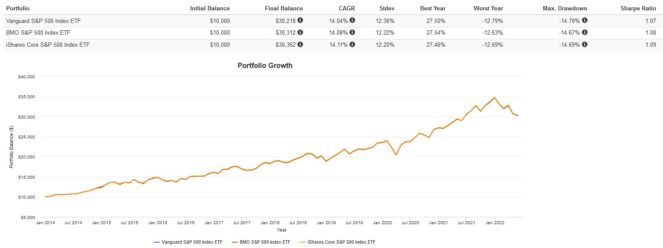
A cautionary statement before we dive in: past performance is no guarantee of future results, which can and will vary. The portfolio returns presented below are hypothetical and backtested. The returns do not reflect trading costs, transaction fees, or taxes, which can cause drag.
Here are the trailing returns from 2013 to present:
Here are the annual returns from 2013 to present:
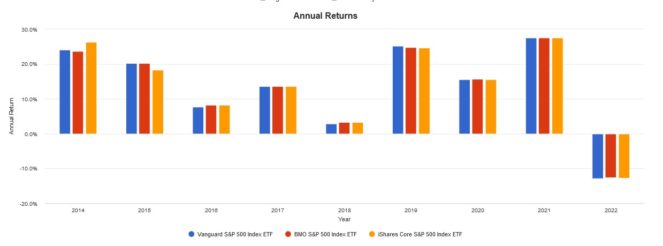
It’s a coin toss here. All three ETFs had virtually identical returns and volatility, with some very insignificant differences due to tracking error.
The Foolish takeaway
You can’t go wrong with any of these options. All three ETFs have nearly identical management expense ratios and performance. If you’re fond of BMO, pick ZSP. If you idolize Jack Bogle, buy VFV. If you like BlackRock, consider XUS.