Welcome to a series where I break down and compare some of the most popular exchange-traded funds (ETFs) available to Canadian investors!
The tech-heavy NASDAQ 100 Index is down heavily year to date as a result of rising interest rates and high market volatility. The current correction could be a great buying opportunity though. Thankfully, Invesco, BlackRock, and BMO Global Asset Management provide a set of low-cost, high-liquidity ETFs that offer exposure to the NASDAQ 100.
The three tickers up for consideration today are iShares NASDAQ 100 Hedged to Cad ETF (TSX:XQQ), BMO NASDAQ 100 Equity Index ETF (CAD-Hedged) (TSX:ZQQ), and Invesco Nasdaq 100 Index ETF (TSX:QQC.F). Which one is the better option? Keep reading to find out.
XQQ vs. ZQQ vs. QQC.F: Fees
The fee charged by an ETF is expressed as the management expense ratio (MER). This is the percentage that is deducted from the ETF’s net asset value (NAV) over time and is calculated on an annual basis. For example, an MER of 0.50% means that for every $10,000 invested, the ETF charges a fee of $50 annually.
Both XQQ and ZQQ have an MER of 0.39%, making them tied on this front. For a $10,000 portfolio, either ZQQ or XQQ will cost you around $39 per year to hold. However, QQC.F is significantly less expensive at 0.22%, or $22 for a $10,000 portfolio. The nod goes to QQC.F here.
XQQ vs. ZQQ vs. QQC.F: Size
The size of an ETF is very important. Funds with small assets under management (AUM) may have poor liquidity, low trading volume, high bid-ask spreads, and more risk of being delisted due to lack of interest.
XQQ has attracted AUM of $1.72 billion, ZQQ has $1.34 billion, and QQC.F has $462 million. Although all are sufficient for a buy-and-hold investor, XQQ is currently the more popular ETF among Canadian investors.
XQQ vs. ZQQ vs. QQC.F: Holdings
All three ETFs track the NASDAQ 100 Index, which is comprised of the largest 100 non-financial companies listed on the NASDAQ exchange. The index is tilted significantly towards mega-cap growth stocks and is dominated by the technology and telecommunications sectors.
All three ETFs also use currency hedging in their construction. Theoretically, this means that their value will not be affected by fluctuations between the CAD-USD. In practice, the imperfect way the currency futures contracts are rolled forwards introduces tracking error, which results in a drag on performance compared to the index.
XQQ vs. ZQQ vs. QQC.F: Historical performance
A cautionary statement before we dive in: past performance is no guarantee of future results, which can and will vary. The portfolio returns presented below are hypothetical and backtested. The returns do not reflect trading costs, transaction fees, or taxes, which can cause drag.
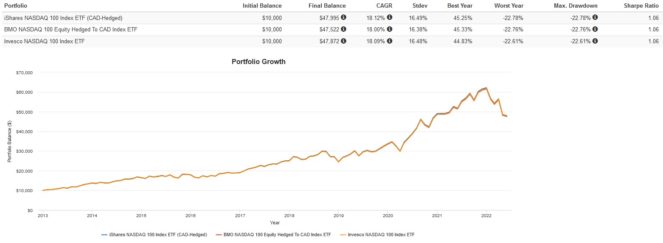
Here are the trailing returns from 2012 to present:
Here are the annual returns from 2012 to present:
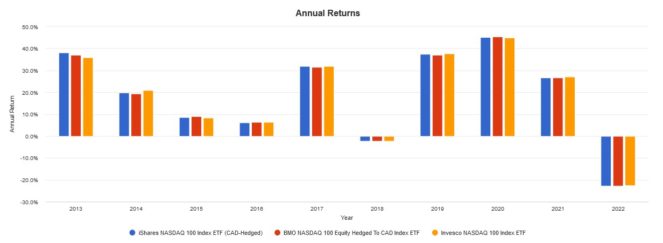
All three ETFs performed virtually identically, as expected from well-managed ETFs from notable fund providers. There is some very small tracking error, but I expect this to even out over time.
The Foolish takeaway
My pick here is for the ETF with the lowest fees. Invesco is a highly reputable fund provider, and its U.S. NASDAQ 100 indexes are heavily traded and used as benchmarks. QQC.F’s much lower MER gives it the edge over ZQQ or XQQ for me, personally. However, if you’re partial to BMO or Blackrock, ZQQ and XQQ are great picks as well.