Welcome to a weekly series where I break down and compare some of the most popular exchange-traded funds (ETFs) available to Canadian investors!
Canadian investors looking to keep their investment portfolios stable often opt for a fixed-income allocation through the use of bond ETFs. Both BlackRock and BMO Global Asset Management provide a set of low-cost, high-liquidity ETFs that offer exposure to a portfolio of investment quality bonds.
The two tickers up for consideration today are iShares Core Canadian Bond Universe Index ETF (TSX:XBB) and BMO Aggregate Bond Index ETF (TSX:ZAG). Which one is the better option? Keep reading to find out.
Image source: Getty Images
XBB vs. ZAG: Fees
The fee charged by an ETF is expressed as the management expense ratio (MER). This is the percentage that is deducted from the ETF’s net asset value (NAV) over time, calculated on an annual basis. For example, an MER of 0.50% means that for every $10,000 invested, the ETF charges a fee of $50 annually.
XBB has an MER of 0.10% compared to 0.09% for ZAG — a difference of $1 in a $10,000 portfolio. The two ETFs are virtually tied, although if I had to pick a winner, it would be ZAG but by a very slim margin.
XBB vs. ZAG: Size
The size of an ETF is very important. Funds with small assets under management (AUM) may have poor liquidity, low trading volume, high bid-ask spreads, and more risk of being delisted due to lack of interest.
XBB currently has AUM of $4.51 billion, whereas ZAG has AUM of $6.40 billion. Both are more than sufficient for a buy-and-hold investor, but ZAG is more popular at this time.
XBB vs. ZAG: Holdings
When selecting a bond ETF, investors should pay attention to three considerations. First, check the credit quality of the bonds. Ideally, you want bonds rated BBB, A, AA, and AAA. You don’t want junk bonds, as our goal here is to reduce volatility, not increase it.
Second, check the composition of the bonds. Bonds are generally separated into corporate and government bonds. Corporate bonds have higher yields but also carry default risk, making them fall when stocks crash. Government bonds have lower yields but virtually no default risk.
Third, check the effective duration of the bond. This is a measure of how sensitive the bond is to interest rate movements. Bond prices move inverse to interest rates. For example, a bond with an effective duration of 8.46 years would lose 8.46% if interest rates rose by 1%.
XBB holds 34.94% federal government bonds, 35.86% provincial government bonds, 26.95% corporate bonds, and 2.23% in municipal bonds. The average effective duration of XBB is 7.78 years, and it currently pays a yield of 2.74%.
ZAG hold 34.28% federal government bonds, 36.89% provincial government bonds, 26.61% corporate bonds, and 2.22% municipal bonds. The average effective duration of ZAG is 7.83 years, and it currently pays a yield of 3.30%.
XBB vs. ZAG: Historical performance
A cautionary statement before we dive in: past performance is no guarantee of future results, which can and will vary. The portfolio returns presented below are hypothetical and backtested. The returns do not reflect trading costs, transaction fees, or taxes, which can cause drag.
The backtest I conducted was not for the bond ETFs in isolation, but how they perform when held as part of a balanced 60/40 stock/bonds portfolio with quarterly rebalancing. This is a realistic depiction of how bond ETFs are used by most investors.
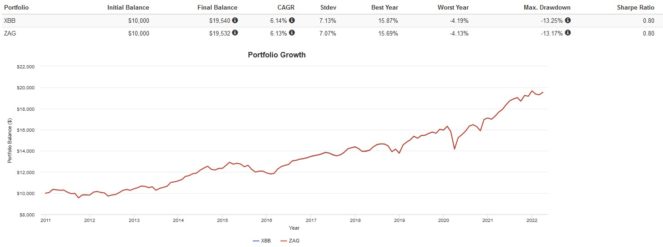
Here are the trailing returns from 2011 to present:
Here are the annual returns from 2011 to present:
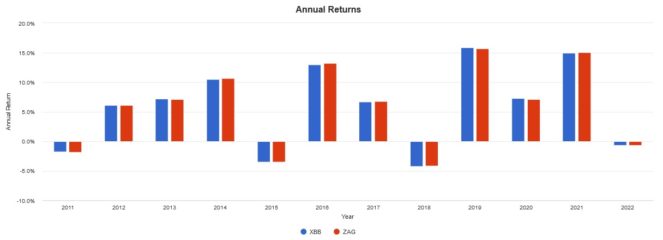
Both performed virtually identically. The annual results might differ very slightly, but this is due to fund rebalancing, turnover, and other portfolio management decisions.
The Foolish takeaway
If I had to choose one ETF to buy and hold, it would be ZAG for the very slightly lower MER and higher AUM. However, both ETFs performed virtually identical over the last few years and will likely do so moving forward. If you’re partial to BlackRock, XBB is an excellent choice as well.